

In 2016, Storey County’s manufacturing sector employed 593 people, a rounding error in Nevada’s economy. A decade later, it employs 14,188, more than the rest of the state has added combined. That single shift explains most of what looks, at first glance, like a dramatic, statewide industrial turnaround.
State data compiled by Lightcast for the Nevada Governor’s Office of Economic Development (GOED) show Nevada manufacturing employment rose 78.9% between 2016 and 2026, from 29,398 jobs to 52,585. Nationally, manufacturing grew just 13.0% over the same decade, meaning Nevada’s sector expanded at nearly six times the national rate.
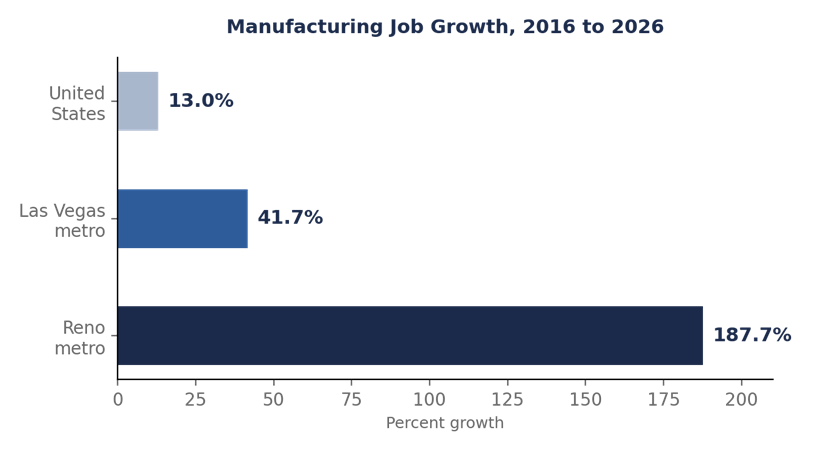
Manufacturing job growth, 2016 to 2026, by region. Source: GOED, Lightcast Q1 2026 Data Set.
Storey County, home to the Tahoe Reno Industrial Center, is the reason the statewide number looks the way it does. Its manufacturing workforce grew roughly 2,292% over the decade, driven largely by battery manufacturing, a category that grew from 463 jobs statewide in 2016 to 14,491 in 2026, concentrated around the industrial park.
Numbers That Do Not Add Up
Two figures in the state’s own report do not hold up against its own underlying data. The first involves Storey County’s share of statewide growth. The GOED summary describes that county as accounting for more than a quarter of all manufacturing jobs Nevada has added since 2016. The actual math says otherwise.
Storey County added 13,595 manufacturing jobs. Statewide, Nevada added 23,187. That is 58.6% of the total, not a quarter of it.
The second involves wages. The state’s report describes Nevada’s manufacturing wages as 26% below the national average. Nevada’s average manufacturing wage was $121,163 in 2025.
The national average was $131,295. The actual gap between those two numbers is 7.7%, not 26%. Two Nevadas found no explanation for either discrepancy anywhere in the underlying GOED data, and both are worth noting because they come from the same report state officials point to when describing the success of Nevada’s diversification strategy.
Reno Booms, Las Vegas Waits
The growth is not shared evenly. Manufacturing jobs in the Reno metro area grew 187.7% since 2016, from 7,548 to 21,717. In the Las Vegas metro area, Clark County, growth was 41.7%, from 16,961 to 24,034 jobs, well above the national rate, but a fraction of Reno’s pace.
The same divide shows up in the state’s unemployment figures. In June 2026, the Las Vegas Henderson metro area’s unemployment rate was 5.2%, according to the Nevada Department of Employment, Training and Rehabilitation. The Reno Sparks metro area’s rate was 4.1%, a full percentage point lower.
Nevada’s statewide unemployment rate has run among the highest in the nation for more than three years, a pattern the manufacturing data helps explain in part, even as growth elsewhere in the labor market has been strong.
State abatement records show both regions have continued to draw new investment, just at different scales. In a 2024 approval, Aqua Metals Reno, a battery recycling company, was cleared for a Storey County expansion projected to create 39 jobs at an average wage of $41.30 an hour.
In the same approval round, Edgewood Renewables, a biorefinery producing renewable diesel and sustainable aviation fuel, was cleared for a larger, $96.5 million Clark County project, according to the Nevada Governor’s Office. Individual projects still land in both counties. It is the decade of cumulative totals that tilts so heavily toward Storey County.
The Diversification Math
GOED’s own framing of the sector rests on a jobs multiplier of 4, meaning every manufacturing job is estimated to support roughly four additional jobs elsewhere in the regional economy.
The state counted 1,826 payrolled manufacturing business locations as of 2025. Demographically, Nevada’s manufacturing workforce in 2026 was 69.0% male and 31.0% female, and the largest single age group was workers 25 to 34, who made up 24.5% of the sector.
A separate, broader measure, the state’s Current Employment Statistics dashboard, put statewide manufacturing employment at 68,500 jobs in June 2026, up just 0.7% from a year earlier.
That figure differs from the 52,585 reported in the GOED and Lightcast industry analysis because the two datasets use different methodologies and employer classifications.
Both describe the underlying trend as positive, just at very different current speeds, a distinction that matters when officials cite either number without saying which one they mean.
What Comes Next
GOED has not published a forecast specific to the manufacturing sector. But the scale of investment already committed in Storey and Washoe counties suggests the gap between Nevada’s north and south is likely to persist in the near term.
Nevada’s manufacturing story, told at the state level, is a diversification success. Told at the county level, it is one county’s boom, and the rest of the state trying to catch up.
Key Data Callouts
| 78.9% Statewide manufacturing job growth since 2016, nearly six times the 13.0% national rate. | 2,292% Manufacturing job growth in Storey County alone since 2016, driven largely by battery manufacturing. | 187.7% vs 41.7% Manufacturing job growth in the Reno metro area vs. the Las Vegas metro area since 2016. | 5.2% vs 4.1% June 2026 unemployment rate in the Las Vegas metro area vs. the Reno Sparks metro area, per DETR. |
| What the Data Says • Nevada manufacturing employment grew 78.9% from 2016 to 2026, nearly six times the national rate. • Storey County accounts for more than half of all manufacturing jobs Nevada has added since 2016. • The state’s cited manufacturing wage gap of 26% does not match its own reported wage figures, which show a 7.7% gap. • The Las Vegas metro unemployment rate has stayed roughly a full point above Reno Sparks through 2026. |
| Why It Matters • Las Vegas job seekers have seen slower gains from the state’s manufacturing push than Reno has. • The wage data discrepancy raises questions about how the state measures its own diversification progress. • The unemployment gap between the two metros tracks the same divide seen in manufacturing growth. • Individual large projects still reach Clark County, but the decade of totals remain lopsided toward Storey County. |
Sources & Data
• Nevada Governor’s Office of Economic Development (GOED), “Nevada’s Manufacturing Sector,” Lightcast Q1 2026 Data Set. https://goed.nv.gov/wp-content/uploads/2026/02/Manufacturing.pdf
• Nevada Department of Employment, Training and Rehabilitation (DETR), Local Area Employment Statistics for June 2026, published July 21, 2026. https://nevadaworkforce.com/_docs/Labor-Market-Overview/Current_Sub-State_Release.pdf
• Nevada Governor’s Office, “Governor Joe Lombardo Announces Over 140 New Jobs and Over $120 Million in New Capital Investments,” Jan. 25, 2024. https://www.gov.nv.gov/press-releases/icymi-governor-joe-lombardo-announces-over-140-new-jobs-and-over-120-million-in-new-capital-investments/
Two Nevadas. Independent local reporting. All figures sourced directly to the issuing agency or organization.